4D 機器學習-上午
程式碼 一、
import numpy as np            # 匯入 NumPy,用來做矩陣運算
import matplotlib.pyplot as plt      # 匯入 Matplotlib,用來畫圖
from scipy.linalg import expm    # 從 SciPy 匯入 expm,用來計算矩陣指數 e^(Qt)
程式碼 二、
def make_Q(h1, h2, h3, h4, rate_unit="year", target_unit="month"):
    """Build Q-matrix for CTMC"""       # 建立連續時間馬可夫鏈 (CTMC) 的 Q 矩陣
    factor = 1/12.0 if rate_unit == "year" and target_unit == "month" else 1.0  # 如果輸入是「每年率」,要轉換成「每月率」(除以 12),否則維持不變
    h1, h2, h3, h4 = np.array([h1, h2, h3, h4], dtype=float) * factor       # 把輸入 hazard 轉換成浮點數並套用單位換算

    Q = np.zeros((4,4), dtype=float)              # 建立 4x4 的零矩陣
    Q[0,0] = -h1; Q[0,1] =  h1                # 狀態0 (Normal) → 狀態1 (Pre) 的轉移率 h1
    Q[1,0] =  h4; Q[1,1] = -(h2 + h4); Q[1,2] = h2   # 狀態1 可能回到0 (率 h4),或往2 (率 h2),對角線是負的總和
    Q[2,2] = -h3; Q[2,3] =  h3                # 狀態2 (Stage 1) → 狀態3 (Stage 2),率 h3
    return Q                            # 回傳生成的 Q 矩陣
程式碼 三、
def transition_matrix(Q, t):
    """Transition probability matrix P(t) = expm(Q*t)"""   # 計算 P(t)=e^(Qt),即時間 t 的轉移機率矩陣
    return expm(Q * t)
程式碼 四、
def simulate_from_state0(Q, t_grid):
    """Simulate probabilities starting from state 0"""         # 從狀態0 (Normal) 開始模擬隨時間的機率分布
    p0 = np.array([1,0,0,0], dtype=float)                 # 初始機率分布:一開始全部在 Normal 狀態
    return np.vstack([p0 @ transition_matrix(Q, t) for t in t_grid]) # 對每個時間點 t,計算 p0*P(t),堆疊成矩陣
程式碼 五、
# ===== 畫圖 =====
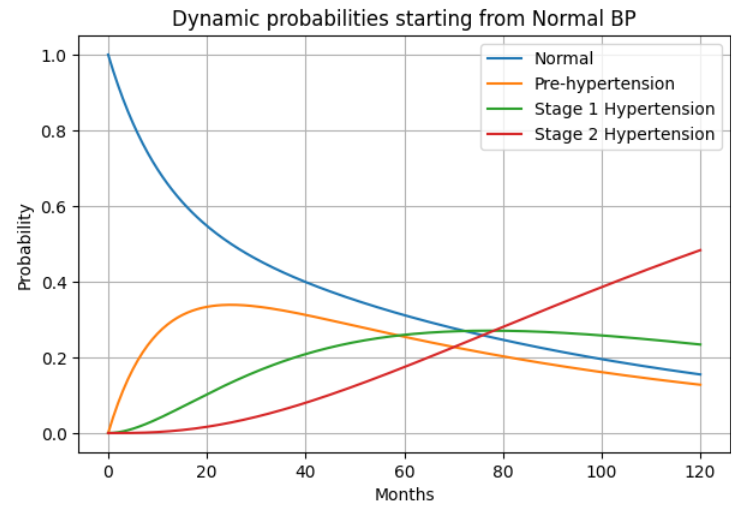
def plot_curves(t_grid, probs):
labels = ['Normal', 'Pre-hypertension', 'Stage 1 Hypertension', 'Stage 2 Hypertension'] # 狀態標籤
plt.figure(figsize=(7,4.5)) # 設定圖表大小
for i in range(4):
plt.plot(t_grid, probs[:, i], label=labels[i]) # 畫出每個狀態隨時間的機率曲線
plt.xlabel('Months') # x 軸標籤:月份
plt.ylabel('Probability') # y 軸標籤:機率
plt.title('Dynamic probabilities starting from Normal BP') # 圖標題
plt.legend() # 顯示圖例
plt.grid(True) # 顯示格線
plt.show() # 顯示圖表
程式碼 六、
# hazards per year
h1, h2, h3, h4 = 0.5271, 0.3077, 0.2378, 0.4706 # 四個 hazard 值 (每年)
Q = make_Q(h1, h2, h3, h4, rate_unit="year", target_unit="month") # 建立 Q 矩陣,並將年率轉換成月率
t_grid = np.linspace(0, 120, 241) # 建立時間網格,從 0 到 120 個月,取 241 個點 (每 0.5 個月一個點)
probs = simulate_from_state0(Q, t_grid) # 計算從 Normal 狀態開始的機率隨時間變化
# Plot
plot_curves(t_grid, probs) # 畫出四個狀態的機率曲線
# Show transition matrices
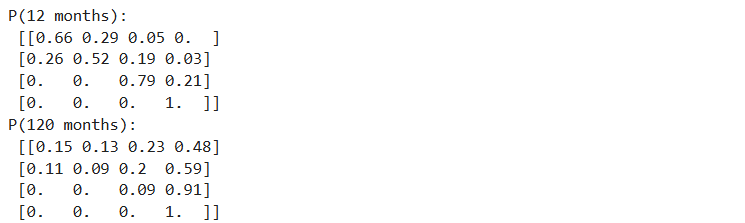
print("P(12 months):\n", np.round(transition_matrix(Q, 12), 2))
print("P(120 months):\n", np.round(transition_matrix(Q, 120), 2))
結果顯示