4D 機器學習-上午
程式碼 一、
import warnings
warnings.filterwarnings("ignore", category=UserWarning, module="matplotlib")
import logging

# close warning of matplotlib.font_manager
logging.getLogger("matplotlib.font_manager").setLevel(logging.ERROR)

# install Noto Sans CJK
!apt-get -yqq install fonts-noto-cjk > /dev/null
import glob, os
import matplotlib.pyplot as plt
from matplotlib import font_manager as fm

# identify fonts path
candidates = [
    "/usr/share/fonts/opentype/noto/NotoSansCJK-Regular.ttc",
    "/usr/share/fonts/opentype/noto/NotoSansCJK-*.ttc",
    "/usr/share/fonts/truetype/noto/NotoSansCJK-Regular.ttc",
    "/usr/share/fonts/truetype/noto/NotoSansCJK-*.ttc",
]
paths = []
for pat in candidates:
    paths += glob.glob(pat)

if not paths:
    import subprocess, textwrap
    out = subprocess.check_output("fc-list | grep -i noto || true", shell=True).decode()
    raise RuntimeError("ไม่พบไฟล์ NotoSansCJK บนระบบ\n" + out)

font_path = paths[0]
myfont = fm.FontProperties(fname=font_path)

plt.rcParams['axes.unicode_minus'] = False

# test fonts
plt.plot([0,1],[0,1])
plt.title("測試中文字:你好,世界!", fontproperties=myfont)
plt.xlabel("橫軸", fontproperties=myfont)
plt.ylabel("縱軸", fontproperties=myfont)
plt.show()
結果顯示
程式碼 二、
import numpy as np
from scipy.integrate import solve_ivp
import matplotlib
import matplotlib.pyplot as plt
from scipy.linalg import expm
程式碼 三、
#### beta value

H_PARAMS = {
    "male": np.array([
        0.4913332, 0.2213734, 0.8815853, 0.4545329, 0.1976197,
        0.2410862, 0.530457, 0.6860093, 0.0000632, 0.2999933,
        0.3619496, 0.6241367, -0.174284, -0.171291, -0.591518,
        -0.561056, 0.1492328, -0.165426, -0.10697, -0.204123,
        -0.294975, 0.5274535, 0.5039811, -0.016425, 0.1328074,
        0.1014438, -0.352403, -0.219253, 0.3027916, 0.0895952,
        0.0398297, -0.110485, 0.1272203, -0.090854, 0.0078329,
        -0.119727, -0.050465, 0.2877521, 0.042185, 0.0642451,
        0.2460654, 0.3739641, -0.621133, -0.648847, 0.2271922,
        0.3553178, -0.063328, -0.391873, -0.024258, 0.6949756,
        -0.574587, -0.27161, 0.0411428, -0.325095, 0.0265496,
        0.4057065, -0.313752, -0.030563, 0.4710069, -0.603974,
        -0.549932, 0.430422, -0.003279, -0.318728
    ]),
    "female": np.array([
        0.4688688, 0.1420304, 0.170552, 1.4392708, 0.1564509,
        0.2568985, 0.3582668, 0.5695758, 1.0221333, 0.4624671,
        0.4495771, 0.8485589, 1.0504668, 1.2450604, 0.3146347,
        0.4399219, 0.0341317, -0.051883, 0.5829201, -0.157637,
        -0.345051, -0.639615, -0.681005, -0.38326, -0.149655,
        0.3171387, -0.166799, 0.5199036, 0.2076614, -0.567479,
        -0.124114, -0.140013, -0.034385, 0.0704603, -0.081293,
        0.1028878, -0.022322, 0.1663116, -0.04727, -0.404537,
        -0.047235, -0.087211, 0.3253022, 0.2911713, -0.390829,
        -0.314242, 0.1842663, -1.378903, 0.1765547, -8.095463,
        0.0779577, 0.2557185, 0.2805068, 0.0682177, 0.0195466,
        -0.221324, -0.476927, 0.1771261, 0.0500983, -0.168873,
        -0.173135, -0.052724, -0.400486, -0.279757
    ])
}
程式碼 四、
#######features and position mapping
# base covariate keys
BASE_KEYS = [
    'education','bmi','waist','ac','tc','smk',
    'drink','exergp','htnhx','ua'
]

# config each gender
CONFIG = {
    "male": {
        "age_ranges": [(40,49),(50,59),(60,69),(70,79)],
        "age_idx_base": [4, 8, 12, 16],
        "cov_idx_base": [20, 31, 42, 53],
        "covariate_keys": BASE_KEYS[:6] + ['betel'] + BASE_KEYS[6:]
    },
    "female": {
        "age_ranges": [(40,44),(45,49),(50,59),(60,69),(70,79)],
        "age_idx_base": [4, 9, 14, 19],
        "cov_idx_base": [24, 34, 44, 54],
        "covariate_keys": BASE_KEYS
    }
}
程式碼 五、
#####Q function
# Create Q Matrix
def make_Q(profile: dict, sex: str = 'male') -> np.ndarray:
    """
     Q-matrix 4x4 for Markov model
    - profile: dict features such as age, education, bmi, ...
    - sex: 'male' or 'female'
    """
    sex = sex.lower()
    h = H_PARAMS[sex]
    cfg = CONFIG[sex]

    # 1) flag for age groups
    age_groups = [int(lo <= profile['age'] <= hi) for lo, hi in cfg["age_ranges"]]

    # 2) hazard function calculation
    def compute_h(base_h, base_age_idx, base_cov_idx):
        terms = []
        # age term
        for i, flag in enumerate(age_groups):
            if flag:
                terms.append(h[base_age_idx + i])
        # covariate term
        for j, key in enumerate(cfg["covariate_keys"]):
            terms.append(h[base_cov_idx + j] * profile[key])
        return base_h * np.exp(np.sum(terms))

    # 3) h1-h4 calculation
    h_list = [
        compute_h(h[k], cfg["age_idx_base"][k], cfg["cov_idx_base"][k])
        for k in range(4)
    ]
    h1, h2, h3, h4 = h_list

    # 4) Q-matrix
    Q = np.zeros((4, 4))
    Q[0, 0] = -h1
    Q[0, 1] = h1
    Q[1, 1] = -(h2 + h4)
    Q[1, 2] = h2
    Q[1, 0] = h4
    Q[2, 2] = -h3
    Q[2, 3] = h3
    Q[3, 3] = 0  # absorbing
    return Q
程式碼 六、
####plot& P matrix
def plot_state_probabilities(profile: dict, title: str = "High Risk", sex: str = "male", months: int = 120):
    """
     Q-matrix from profile, solve ODE และ plot graph
    """
    # 1. Create Q matrix
    Q = make_Q(profile, sex=sex) / 12.0  # Year >> Month

    # 2. ODE
    def ode(t, p):
        return p @ Q

    # 3. state 0
    p0 = [1, 0, 0, 0]

    # 4. time period
    t_eval = np.linspace(0, months, 100)
    sol = solve_ivp(ode, [0, months], p0, t_eval=t_eval)

    # 5. Plot
    labels = ['正常血壓', '高血壓前期', '第一期高血壓', '第二期高血壓']
    for i in range(4):
        plt.plot(sol.t, sol.y[i], label=labels[i])
    plt.legend(prop=myfont)
    plt.xlabel('月', fontproperties=myfont)
    plt.ylabel('機率', fontproperties=myfont)
    plt.title(f'{title}', fontproperties=myfont)
    plt.grid(True)
    plt.show()


def get_P_matrix(Q, t, decimals=4):
    from scipy.linalg import expm
    P = expm(Q * t)
    return np.round(P, decimals)
t = 12  # 12 month
程式碼 七、
###caseA
case_1_profile = {
'age': 65, 'education': 0, 'bmi': 1, 'waist': 1, 'ac': 1, 'tc': 1, 'smk': 1,
'betel': 1, 'drink': 1, 'exergp': 1, 'htnhx': 0, 'ua': 1
}
q_case_1 = make_Q(case_1_profile, sex='male')
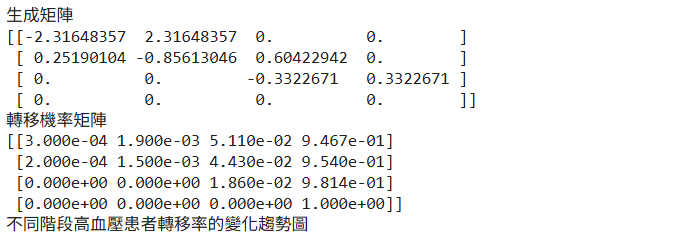
print("生成矩陣")
print(q_case_1)
P = get_P_matrix(q_case_1, t)
print("轉移機率矩陣")
print(P)
print("不同階段高血壓患者轉移率的變化趨勢圖")
plot_state_probabilities(case_1_profile, title='High Risk', sex="male", months=120)
結果顯示